Skip to content

Conversation

matthewfeickert
Copy link
Member

@matthewfeickert matthewfeickert commented Mar 20, 2021

Resolves #148

This PR adds support for ratio plots to the .plot... API by adding .plot_ratio and refactoring .plot_pull to use .plot_ratio.

This PR is still very rough, but I thought I'd open it up as there is a minimal working example now and then revise it heavily from there.

As the commit log is huge and messy I'll rebase and squash things into more reasonable commit sections to make review more digestible.

Questions to come to consensus on

(Discussion can happen on Issue #148)

  • Should the interval functions be moved to their own stat_interval module?

Answer: Yes, this is PR #176.

TODO before requesting review

  • Finish refactoring .plot_pull
  • Add kwargs and kwargs filtering support
  • Fix typing errors
  • Add tests
  • All tests are passing
  • Docstrings added
  • README updated
  • Changelog updated.

Suggested squash and merge message

* Add .plot_ratio to BastHist API
   - Adds ratio plot support for other Hists and callables
* Factor out plot_ratio and plot_pull to perform the final subplot plotting
   - Majority of logic is factored out of plot_pull into _plot_ratiolike
   - _plot_ratiolike then calls plot_ratio or plot_pull as needed
* Add plotting tests and test images for plot_ratio
* Update test image for plot_pull
* Update README and Changelog to reflect addition of plot_ratio

Co-authored-by: Henry Schreiner <[email protected]>

@matthewfeickert matthewfeickert added the enhancement New feature or request label Mar 20, 2021
@matthewfeickert matthewfeickert self-assigned this Mar 20, 2021
@matthewfeickert
Copy link
Member Author

matthewfeickert commented Mar 20, 2021

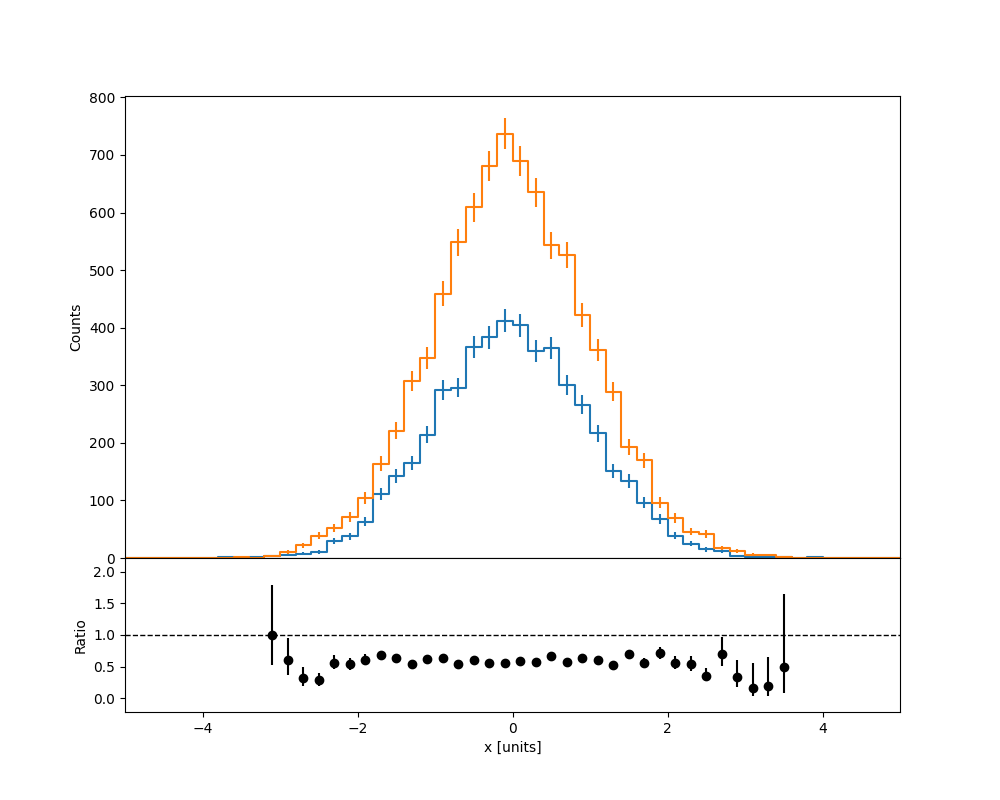
Minimal toy working example before beginning revision work:

# example.py
import matplotlib.pyplot as plt
import numpy as np

import hist

if __name__ == "__main__":
    np.random.seed(0)

    n_fill_1 = 5000
    n_fill_2 = n_fill_1 * 1.7

    hist_1 = hist.Hist(
        hist.axis.Regular(
            50, -5, 5, name="X", label="x [units]", underflow=False, overflow=False
        )
    ).fill(np.random.normal(size=int(n_fill_1)))
    hist_2 = hist.Hist(
        hist.axis.Regular(
            50, -5, 5, name="X", label="x [units]", underflow=False, overflow=False
        )
    ).fill(np.random.normal(size=int(n_fill_2)))

    fig = plt.figure(figsize=(10, 8))
    artists = hist_1.plot_ratio(hist_2)
    fig.savefig("hist_ratio_plot.png")

hist_ratio_plot

Support for both callables and hists exists.

@matthewfeickert matthewfeickert force-pushed the feat/add-plot-ratio-api branch from 1d9ab39 to 05071ba Compare March 22, 2021 22:32
@matthewfeickert matthewfeickert force-pushed the feat/add-plot-ratio-api branch 2 times, most recently from 3539424 to 897a582 Compare March 23, 2021 20:54
@matthewfeickert
Copy link
Member Author

@henryiii This PR still isn't done, as I still have plenty to do on the checklist I added in the PR body, but after I rebase this off PR #168 if you have time to give general thoughts and feedback on better design of the refactor and clarity of control flow I would be very happy to make any and all suggested revisions while adding tests and docs.

@matthewfeickert matthewfeickert force-pushed the feat/add-plot-ratio-api branch from e70bce0 to 73ec024 Compare March 24, 2021 16:05
@matthewfeickert
Copy link
Member Author

matthewfeickert commented Mar 24, 2021

(Copying from #161 (comment) to make it easier for me to find later)

but, better yet, can't pull just call ratio, and then modify a bit if needed, rather than having them merged like this? Having factored out functions is better, and it seems like you were mostly there. You'd have a plot_fit, a plot_ratio, then plot_pull would make two axes (or be given two axes) and then plot_fit on one, and plot_ratio on the other.

Oh, I see the CI is failing as mypy is complaining as typing.Literal was added in Python 3.8. I assume there's some way to get things to work with older Pythons, so I'll fix this. (Edit: yes — through the typing-extensions package).

As for having plot_pull call plot_ratio I'm a bit confused as how that would work given that plot_pull and plot_ratio are plotting different quantities in their subplots. I guess I could see something like plot_pull and plot_ratio both calling things like plot_fit (and some other function to just plot the two histograms for a ratio of two hists) to populate the main axis, and then both calling a revised plot_ratiolike that populates the subplot with the relevant type of plot (pull or ratio).

@matthewfeickert
Copy link
Member Author

Having factored out functions is better, and it seems like you were mostly there.

After doing some more refactoring (perhaps too much?), this PR is getting pretty ugly looking in the review panels. If this is too much (this is definitely no longer atomic) I could make another PR that would do the refactoring of things first and then fix this PR to just do the ratio plot and pull plot work.

You'd have a plot_fit, a plot_ratio, then plot_pull would make two axes (or be given two axes) and then plot_fit on one, and plot_ratio on the other.

As the pulls and the ratios have little overlap in what is actually being plotted (beyond that they are both in a subplot) the current setup has the hist.BaseHist .plot_ratio and .plot_pull functions call _plot_ratiolike. _plot_ratiolike accepts or creates the two axes, manages the calls to be able to fit the callable model to the hist if needed, and calls plotting for the main axis. This is all needed to make both ratio plots and pull plots, so this logic is used in both cases. The plotting of either the ratios or the pulls in the subplot is what plot_ratio or plot_pull manages, which don't really share any logic.

Thoughts? Am I missing something about the logic/design here?

@scikit-hep scikit-hep deleted a comment from sourcery-ai bot Mar 25, 2021
@henryiii
Copy link
Member

The GitHub rich diff tools for images are quite nice, hadn't played with them before (there are three modes, for example). The image changes do not look very good; the band is darker, hiding the function plot, and the data points now plot over the legend.

Copy link
Member

@henryiii henryiii left a comment

Choose a reason for hiding this comment

The reason will be displayed to describe this comment to others. Learn more.

Looks good, I had a few very minor comments. After this goes in, I might try to do a tiny bit of cleanup. (typing.py, fix an Any or two)

@henryiii
Copy link
Member

FYI, this is the changes I tried; no fixes but added strings / callables and removed quotes in plot.py (since matplotlib is available there) (in .patch form if you want to apply them):

diff --git a/src/hist/basehist.py b/src/hist/basehist.py
index 45c1665..cf281a6 100644
--- a/src/hist/basehist.py
+++ b/src/hist/basehist.py
@@ -405,7 +405,7 @@ class BaseHist(bh.Histogram, metaclass=MetaConstructor, family=hist):
 
     def plot_ratio(
         self,
-        other: Callable[[np.ndarray], np.ndarray],
+        other: Union[np.ndarray, str, Callable[[np.ndarray], np.ndarray]],
         *,
         ax_dict: "Optional[Dict[str, matplotlib.axes.Axes]]" = None,
         **kwargs: Any,
@@ -425,7 +425,7 @@ class BaseHist(bh.Histogram, metaclass=MetaConstructor, family=hist):
 
     def plot_pull(
         self,
-        func: Callable[[np.ndarray], np.ndarray],
+        func: Union[str, Callable[[np.ndarray], np.ndarray]],
         *,
         ax_dict: "Optional[Dict[str, matplotlib.axes.Axes]]" = None,
         **kwargs: Any,
diff --git a/src/hist/plot.py b/src/hist/plot.py
index ed3d7b1..c861f37 100644
--- a/src/hist/plot.py
+++ b/src/hist/plot.py
@@ -182,9 +182,9 @@ def _curve_fit_wrapper(
 def plot2d_full(
     self: hist.BaseHist,
     *,
-    ax_dict: "Optional[Dict[str, matplotlib.axes.Axes]]" = None,
+    ax_dict: Optional[Dict[str, matplotlib.axes.Axes]] = None,
     **kwargs: Any,
-) -> "Tuple[Hist2DArtists, Hist1DArtists, Hist1DArtists]":
+) -> Tuple[Hist2DArtists, Hist1DArtists, Hist1DArtists]:
     """
     Plot2d_full method for BaseHist object.
 
@@ -364,7 +364,7 @@ def _plot_fit_result(
 
 def plot_ratio(
     _hist: hist.BaseHist,
-    ratio: np.ndarray,
+    ratio: Union[str, Callable[[np.ndarray], np.ndarray], np.ndarray],
     ratio_uncert: np.ndarray,
     ax: matplotlib.axes.Axes,
     **kwargs: Any,
@@ -456,7 +456,7 @@ def plot_ratio(
 
 def plot_pull(
     _hist: hist.BaseHist,
-    pulls: np.ndarray,
+    pulls: Union[str, Callable[[np.ndarray], np.ndarray], np.ndarray],
     ax: matplotlib.axes.Axes,
     bar_kwargs: Dict[str, Any],
     pp_kwargs: Dict[str, Any],
@@ -505,10 +505,10 @@ def plot_pull(
 
 def _plot_ratiolike(
     self: hist.BaseHist,
-    other: Union[hist.BaseHist, Callable[[np.ndarray], np.ndarray]],
+    other: Union[hist.BaseHist, Callable[[np.ndarray], np.ndarray], np.ndarray, str],
     likelihood: bool = False,
     *,
-    ax_dict: "Optional[Dict[str, matplotlib.axes.Axes]]" = None,
+    ax_dict: Optional[Dict[str, matplotlib.axes.Axes]] = None,
     view: Literal["ratio", "pull"],
     fit_fmt: Optional[str] = None,
     **kwargs: Any,
@@ -676,7 +676,7 @@ def get_center(x: Union[str, int, Tuple[float, float]]) -> Union[str, float]:
 def plot_pie(
     self: hist.BaseHist,
     *,
-    ax: "Optional[matplotlib.axes.Axes]" = None,
+    ax: Optional[matplotlib.axes.Axes] = None,
     **kwargs: Any,
 ) -> Any:

@matthewfeickert matthewfeickert force-pushed the feat/add-plot-ratio-api branch from 9cd3967 to 89c4172 Compare April 10, 2021 17:26
* Ensure default uncertainty band color visible

* bump location of __all__ to just below imports

* Remove quotes

* Rename _hist vars to either __hist or histogram

* Add test for str alias for plot_ratio and plot_pull

* Add str to types for plot_ratiolike

* use TypeVar to type hist.BaseHist
@matthewfeickert matthewfeickert force-pushed the feat/add-plot-ratio-api branch from 89c4172 to b9d0942 Compare April 10, 2021 17:50
@scikit-hep scikit-hep deleted a comment from sourcery-ai bot Apr 10, 2021
Co-authored-by: Henry Schreiner <[email protected]>
@scikit-hep scikit-hep deleted a comment from sourcery-ai bot Apr 11, 2021
Copy link
Member

@henryiii henryiii left a comment

Choose a reason for hiding this comment

The reason will be displayed to describe this comment to others. Learn more.

LGTM! Thanks! I'll likely add your example into the docs.

@henryiii henryiii merged commit 5b261dc into master Apr 11, 2021
@henryiii henryiii deleted the feat/add-plot-ratio-api branch April 11, 2021 01:52
@matthewfeickert
Copy link
Member Author

matthewfeickert commented Apr 11, 2021

LGTM! Thanks! I'll likely add your example into the docs.

Awesome! Thanks for being so helpful and patient on this PR @henryiii — truly appreciate all of your help and guidance here as it ended up being highly educational for me.

@eduardo-rodrigues
Copy link
Member

an argument "gauss" was introduced recently for the most obvious/common use case of the pull plot, so that the user does not have to define that pdf function. Could you not do the same fo the ratio plot? That's not the case in the example above.

@eduardo-rodrigues This is already supported. hist_1.plot_ratio("normal") will work (or "gauss" or "gaus"), but I just didn't show it as such in the example as plot_ratio and plot_pull now share all the logic internals and only differ in what is plotted in the subplot — the main axis plot logic is the same for both.

That's the current design, let's not change that right now. Maybe open a discussion

@andrzejnovak I would second @henryiii's suggestion here.

Thanks @matthewfeickert. I had not appreciated that. I will comment further on the related thoughts from Henry ...

@eduardo-rodrigues
Copy link
Member

I wasn't all that fond of the evaluatable string argument; I would prefer "normal" Python be used, but we should be consistent. I'd be okay to provide a "gauss" function somewhere (hist.gauss or better yet hist.functions.gauss, etc), then remove the strings option entirely, or to only allow "gauss/gaus" and not arbitrary evaulatable strings. But I might be in the minority there too. Let's be consistent, though.

@andrzejnovak That's the current design, let's not change that right now. Maybe open a discussion? The problem is that these tend to get added directly in the function call, so passing a bunch of dicts is potentially more difficult than passing prefixed keywords (for the record, I think I'm on your side, though). I think you can find examples of both types of API in matplotlib. We could add something_kw and combine them, perhaps, etc.

And I tend to agree with you that something more pythonic is preferable, like a callable and a Gaussian function provided by default, for example. Here I'm simply thinking about the user since 99.99% of the time one calls a pull, that's for a Gaussian check (bias and correctness of the error estimation). In that sense, and given that the package is still rather young, I would see no issue in your removing the strings option eventually, TBH. At this point in time, while we don't get there, some consistency is good, as you also say. Happy to continue the discussion in a ... Discussion :-).

matthewfeickert added a commit to matthewfeickert/heputils that referenced this pull request Apr 13, 2021
* Update minimum required version of hist to v2.3.0
   - c.f. scikit-hep/hist#161
* Add stack_ratio_plot to heputils.plot API
   - Will be revised in future release for better API
* Update dev-example notebook with examples of ratio plots
Sign up for free to join this conversation on GitHub. Already have an account? Sign in to comment

Labels

enhancement New feature or request

Projects

None yet

Development

Successfully merging this pull request may close these issues.

[FEATURE] Add ratio plot support to API

6 participants