A powerful Next.js application that generates beautiful, interactive GitHub statistics dashboards for organizations and personal repositories.
-
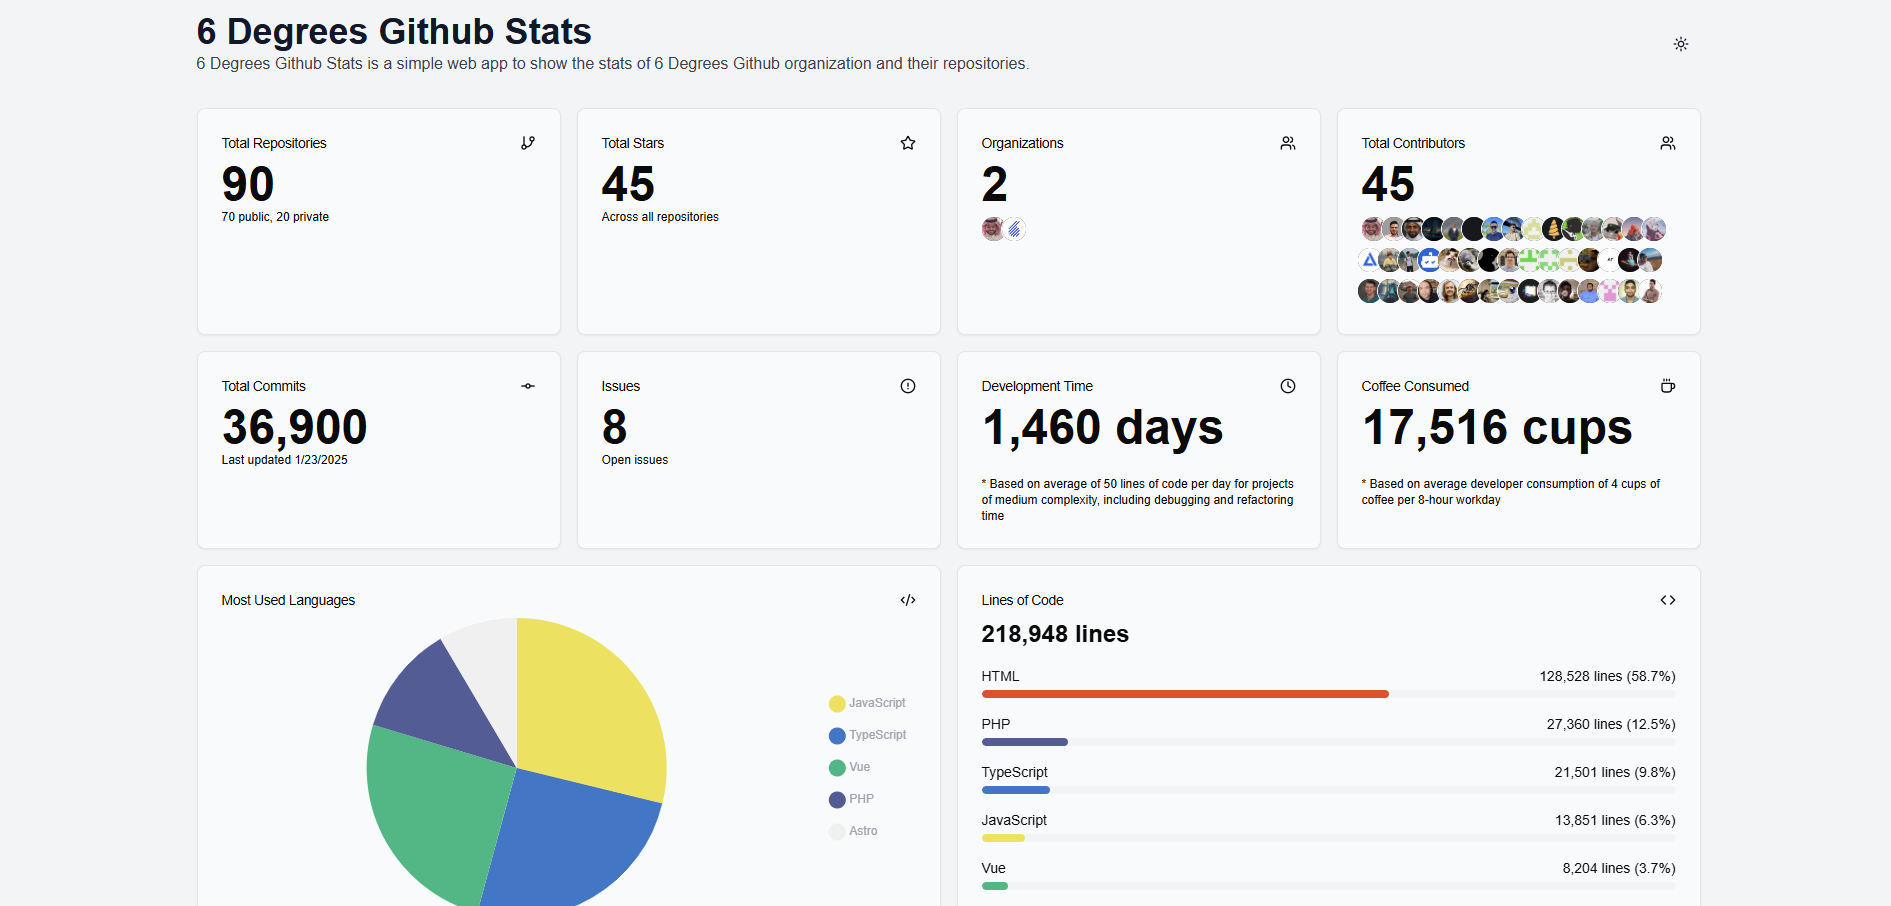
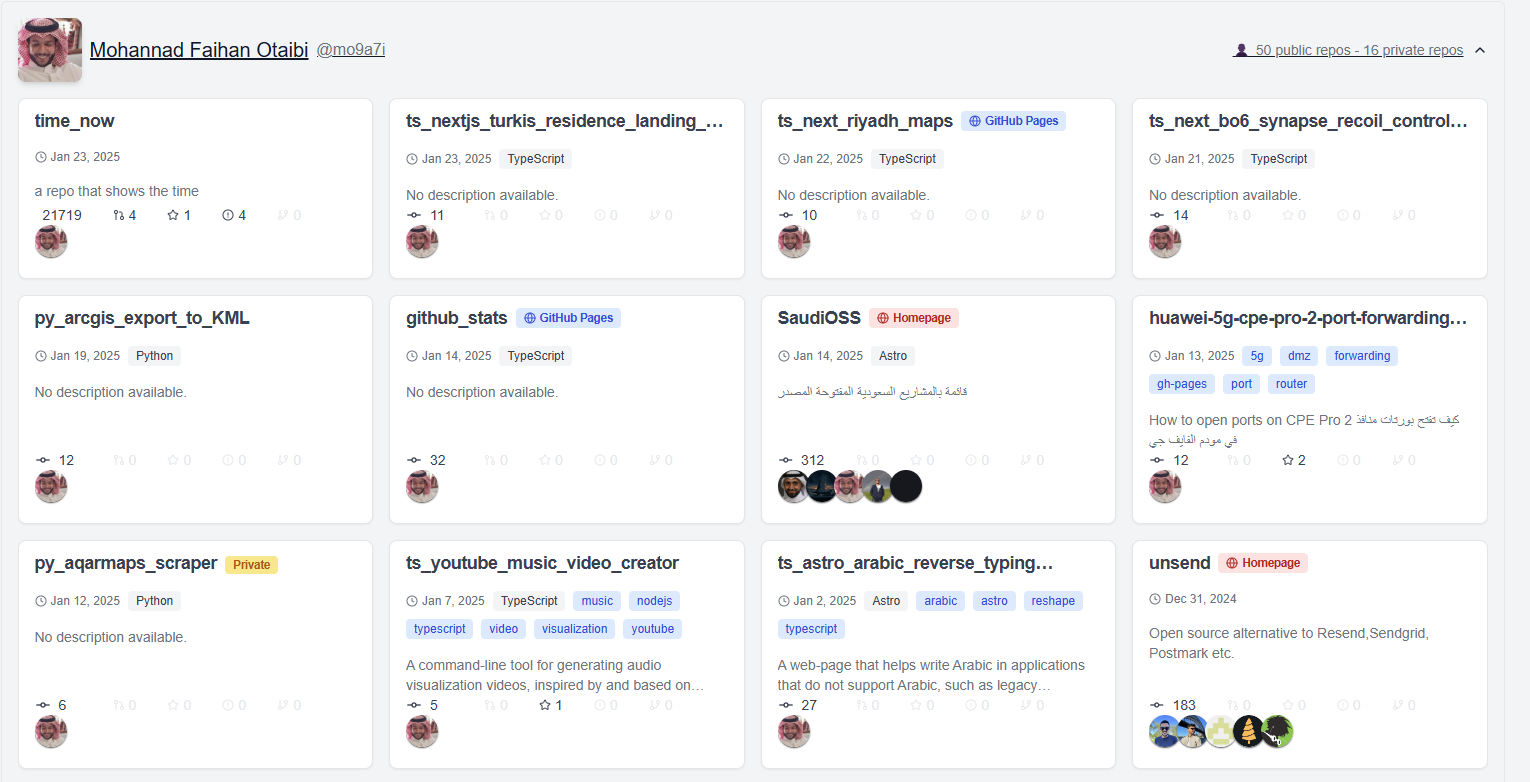
Comprehensive Statistics
- Repository metrics (stars, forks, issues)
- Code analysis (languages, lines of code)
- Contribution insights
- Development time estimates
-
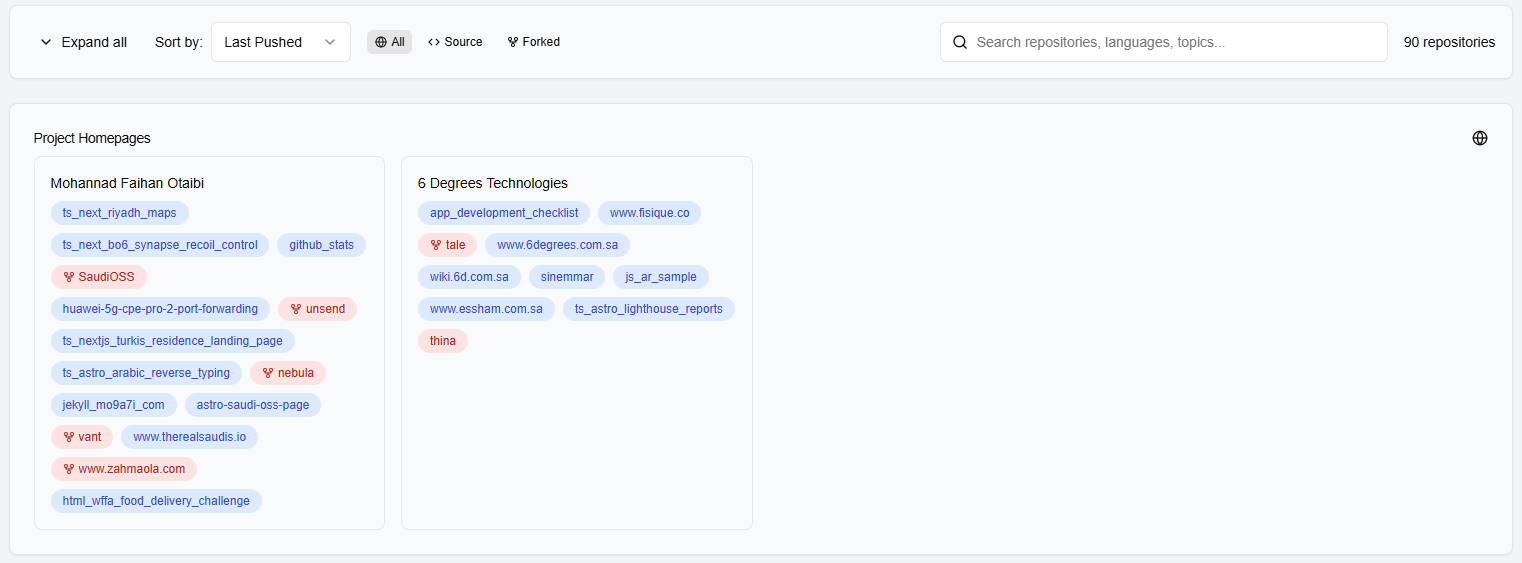
Interactive Dashboard
- Dark/light theme support
- Responsive design
- Real-time data updates
- Filterable repository list
-
Advanced Visualization
- Language distribution charts
- Activity timelines
- Contributor networks
- Performance metrics
- Clone the repository
git clone https://github.com/yourusername/github_stats.git
cd github_stats- Install dependencies
pnpm install- Set up environment variables
Create a .env file in the root directory:
GH_TOKEN=your_github_personal_access_token- Run the development server
pnpm devOpen http://localhost:3000 to view your dashboard.
- Next.js 14 - React framework
- React 18 - UI library
- Chart.js - Data visualization
- Radix UI - UI components
- Tailwind CSS - Styling
- GitHub API - Data source
This application is configured for easy deployment to GitHub Pages using GitHub Actions. The static export ensures optimal performance and reliability.
Contributions are welcome! Please feel free to submit a Pull Request.
- Fork the repository
- Create your feature branch (
git checkout -b feature/AmazingFeature) - Commit your changes (
git commit -m 'Add some AmazingFeature') - Push to the branch (
git push origin feature/AmazingFeature) - Open a Pull Request
This project is licensed under the MIT License - see the LICENSE file for details.
- GitHub API for providing the data
- The amazing open-source community
- All contributors who help improve this project
Built with ❤️ for the GitHub community