Data Studio
Open https://datastudio.google.com and start building dashboards in Data Studio visualising blockchain data.
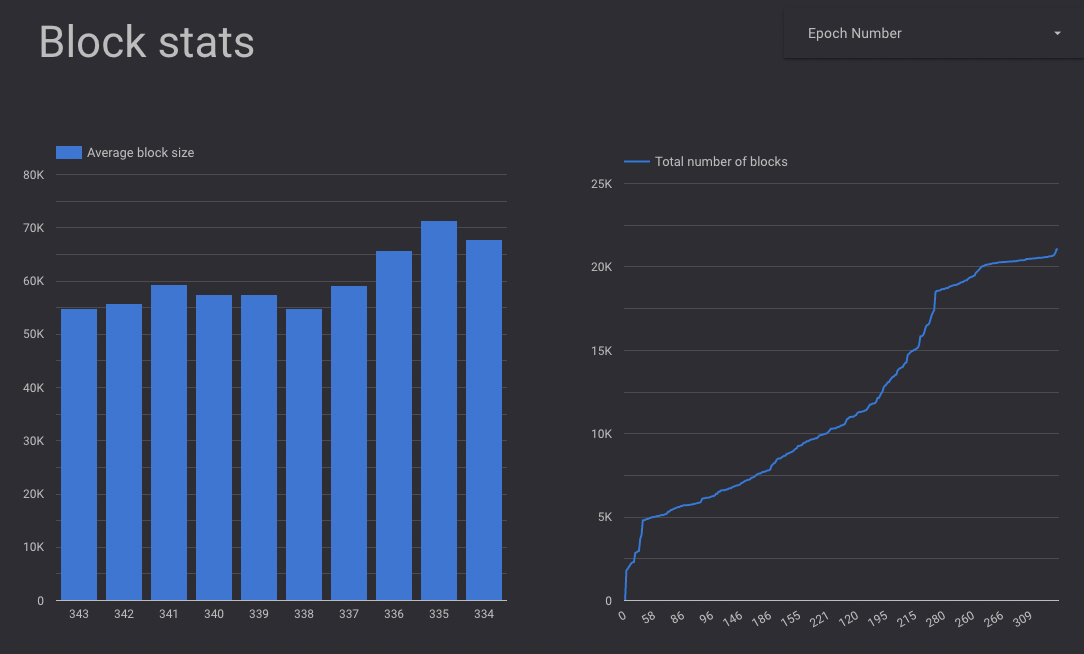
Cardano Chainview🔗 shows a number of graphs about what is happening on the blockchain. You can copy this dashboard and adapt it to your needs.

BigQuery provides seamless integration with Google Data Studio.
To import the data into the Data Studio:
- Create a new report
- Select the BigQuery option:
Select the table you would like to use as your data source, for example let's use the transactions table `tx` to view the number of transactions per day:

Create a new chart, a bar chart for example:

On the right the dimension selected is the `tx_hash`. We would like to view the count of records in the dimension of date. Thus we would need to create a new field in each row, with the date of the transaction, by clicking on the "Add a field" option:

We can simply use the built-in `DATE` function to select the date from the block:

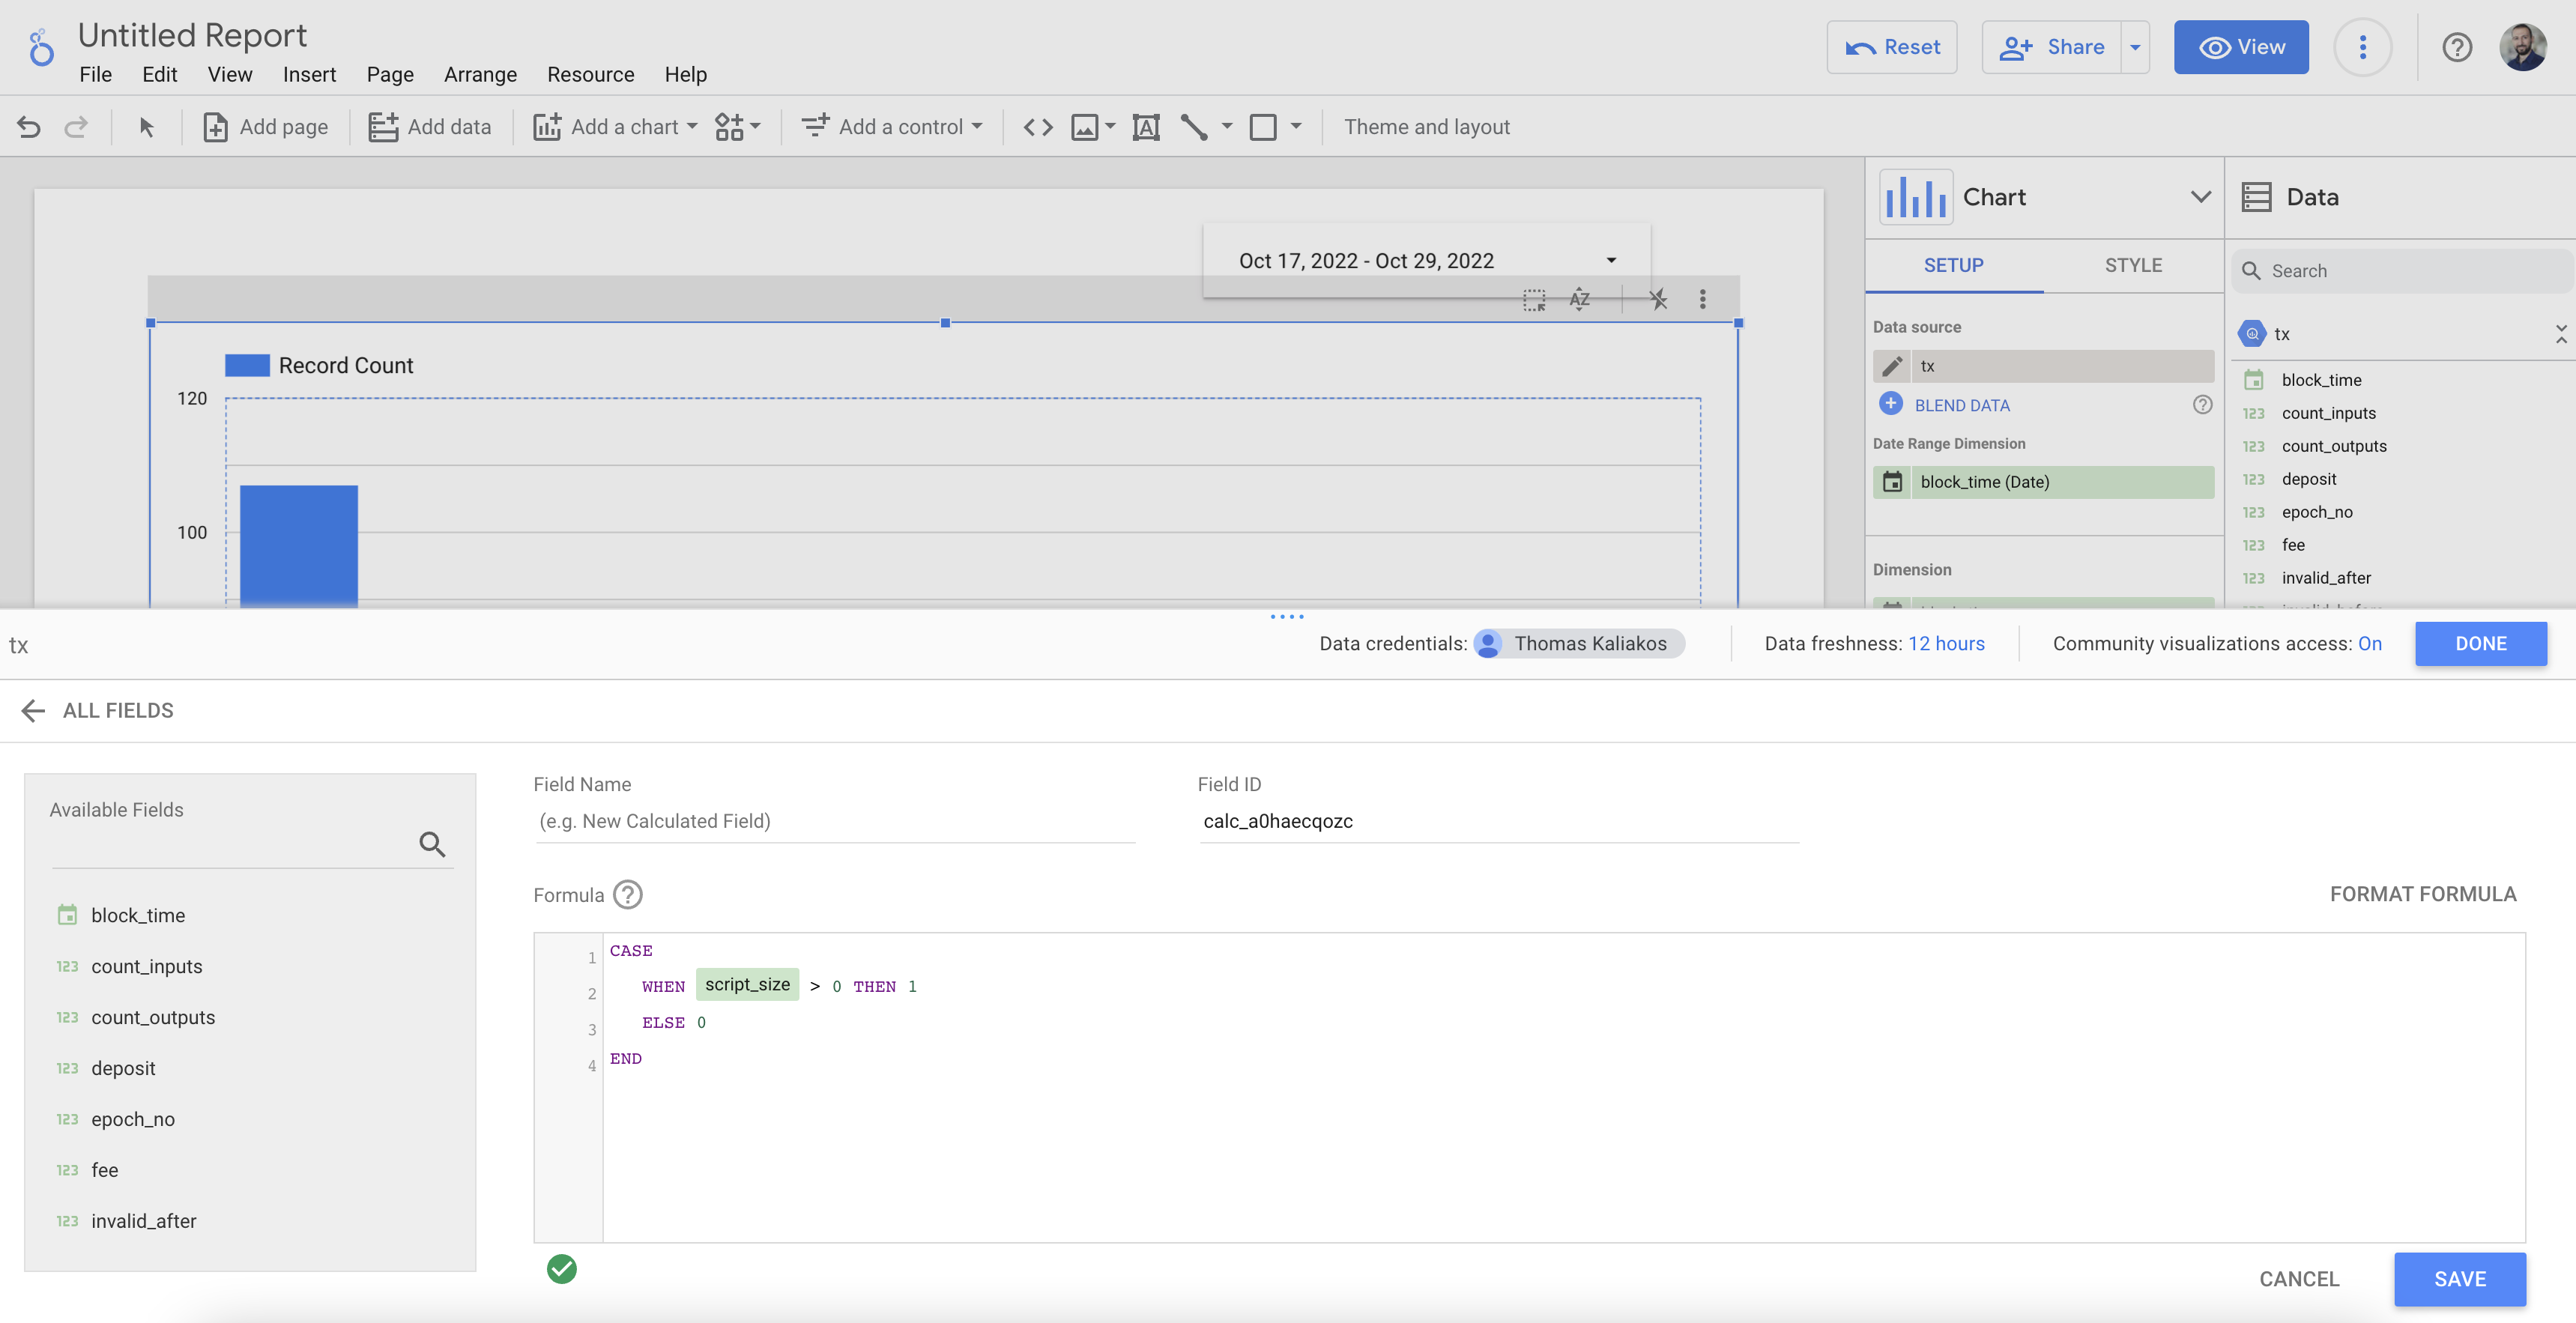
We can also add a new field to calculate if the transaction included a script or not. For example we'll add 1 if the script size is bigger than zero or 0 if it wasn't:
Adding all the things together, we put the new field block date as a dimension and the the sum of the `has_script` field that we created in the "Metric". In this way we can view the total number of transactions per day, as well as the number of transactions with scripts.

You can now be creative and build various charts using the Cardano mainnet dataset!
See more examples in this Data Studio report.
