doc: add performance tuning doc #419
Conversation
9cd73d3 to
8fba075
Compare
5ff6543 to
bc624a3
Compare
|
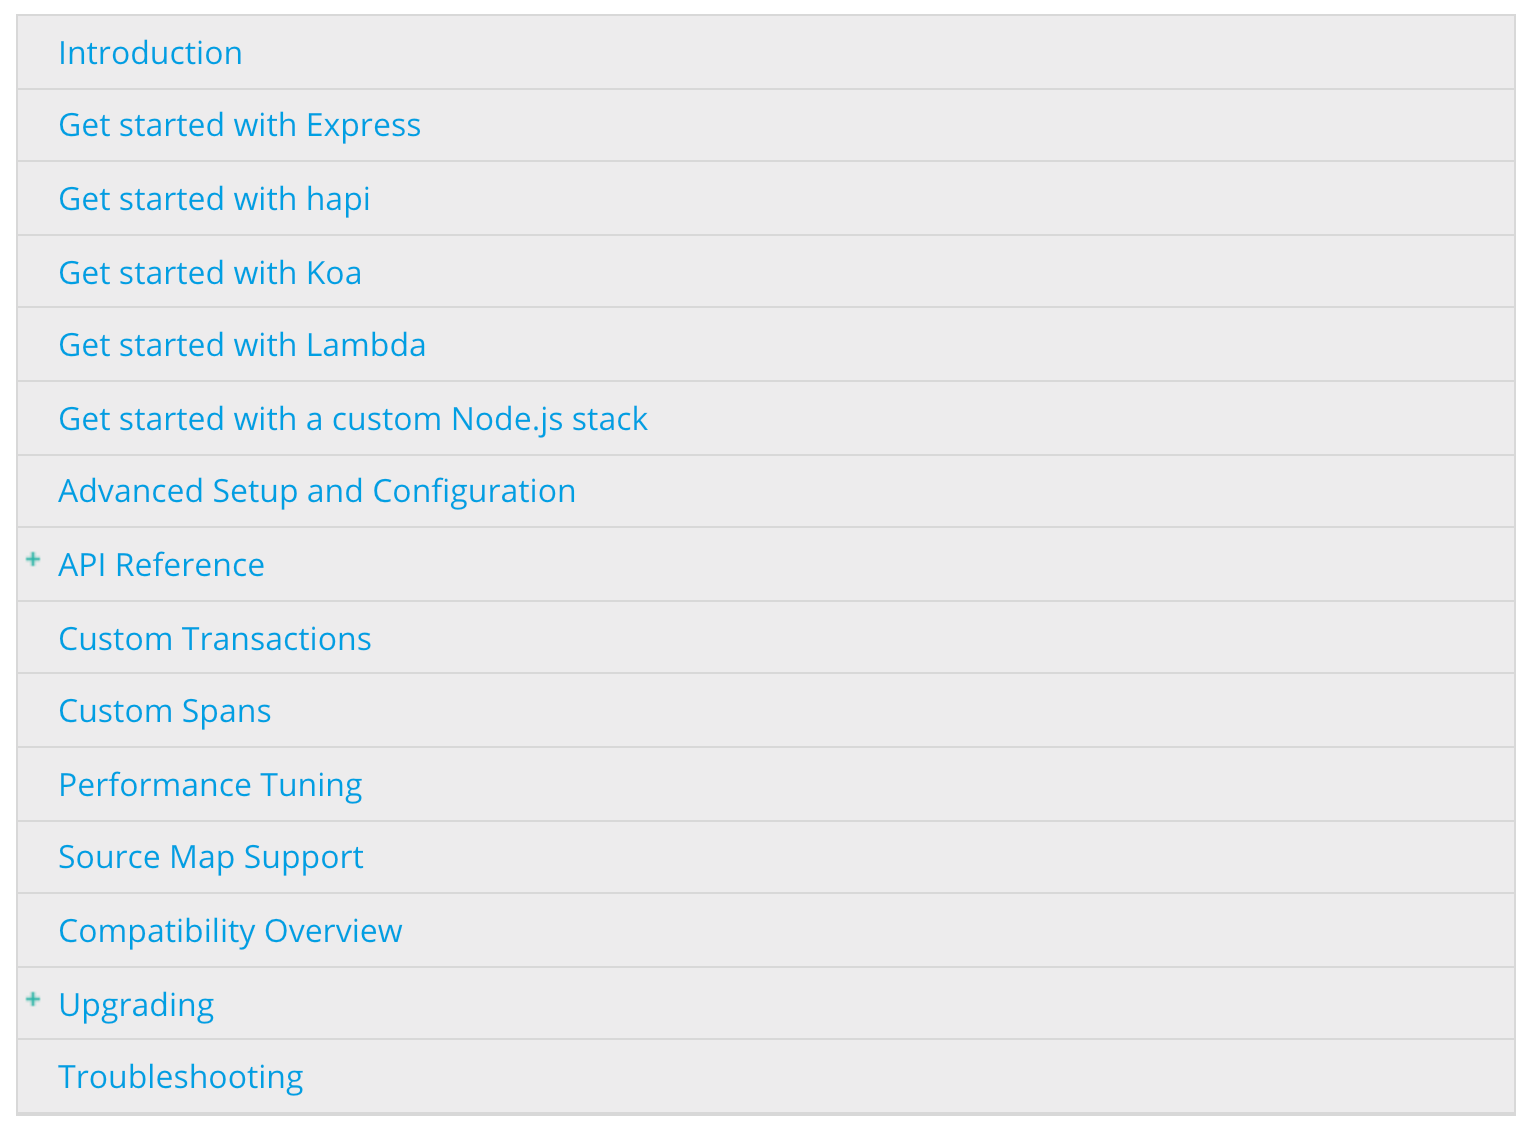
I added a link from the index page to the performance doc and fixed the commit message linter bug. With the new link, the index page will look like this:
I'm not sure if that's the best location for it? I also added line breaks after punctuation marks. I always feels that it's a little excessive when ever I break on all punctuation marks, but at least it saves me from considering each case individually 😅 I also went over the docs to see what other config options could be used to tune the performance. We should consider adding some of these:
|
|
Oh just remembered that we should add a link to this page from the README ToC as well |
docs/performance.asciidoc
Outdated
|
|
||
| ifdef::env-github[] | ||
| NOTE: For the best reading experience, | ||
| please view this documentation at https://www.elastic.co/guide/en/apm/agent/nodejs/current/performance.html[elastic.co] |
There was a problem hiding this comment.
I messed up when I moved some things around and now the actual generated html file is called performance-tuning.html because of the new anchor tag 😅
Option 1: Rename the link to point to performance-tuning.html
Option 2: Keep the link as it is and rename the generated file back to just performance.html
I vote for option 1. But in that case we should also consider renaming the asciidoc file to match the generated html file. Just to make it easier to know what comes from what. All other doc files have a one-to-one filename correlation (setup.asciidoc being the only exception, as it generates advanced-setup.html - but we might consider "fixing" that as well).
What do you think?
There was a problem hiding this comment.
Option 1 sounds good to me.
docs/performance.asciidoc
Outdated
| [[performance-transaction-queue]] | ||
| === Transaction Queue | ||
|
|
||
| The agent uses a queue to send to the apm server in batches. |
There was a problem hiding this comment.
I find this paragraph a little hard to parse for some reason. How about something along the lines of this instead:
The agent buffers the collected data using an in-memory queue before sending it to the APM Server.
The queue is flushed either after a specific <<performance-flush-interval,amount of time>> or when it reaches <<performance-max-queue-size,a certain size>> -
whichever comes first.
Lowering these defaults can reduce memory usage,
but will increase the number of requests to the APM Server.
docs/performance.asciidoc
Outdated
| This queue uses both a time interval and a size limit to balance memory usage against socket descriptor saturation. | ||
|
|
||
| [float] | ||
| [[performance-max-queue-size]] |
There was a problem hiding this comment.
I would move this section below the performance-flush-interval section, so that they are listed in the same order as described above
| [[performance-flush-interval]] | ||
| ==== Flush Interval | ||
|
|
||
| To prevent items from staying in the queue for a long time during low activity, |
There was a problem hiding this comment.
Missing link to the config option
docs/performance.asciidoc
Outdated
| [[performance-max-queue-size]] | ||
| ==== Max Queue Size | ||
|
|
||
| The <<max-queue-size,`maxQueueSize`>> controls the maximum number of request transactions that may remain in the queue before they must be sent. |
There was a problem hiding this comment.
s/request transactions/transactions/
(all transactions are added to the queue, not only request transactions)
docs/performance.asciidoc
Outdated
| The <<max-queue-size,`maxQueueSize`>> controls the maximum number of request transactions that may remain in the queue before they must be sent. | ||
|
|
||
| Lowering this will reduce memory consumption, | ||
| however it will increase the number of requests made to the apm server. |
There was a problem hiding this comment.
Same goes for any other location in this doc where it says apm server
docs/performance.asciidoc
Outdated
| [[performance-server-timeout]] | ||
| === Server Timeout | ||
|
|
||
| In the event that the connection to the apm server is slow or unstable, |
There was a problem hiding this comment.
Missing link to the config option
docs/performance.asciidoc
Outdated
|
|
||
| [float] | ||
| [[performance-server-timeout]] | ||
| === Server Timeout |
There was a problem hiding this comment.
Consider renaming this headline to "APM Server Timeout"
| [[performance-error-log-stack-traces]] | ||
| ==== Error Log Stack Traces | ||
|
|
||
| Most stack traces recorded by the agent will point to where the error was instantiated, |
There was a problem hiding this comment.
Missing link to the config option
There was a problem hiding this comment.
The level of detail here is great, but the content needs a separate technical edit after the content has been reviewed for technical accuracy and merged. I've added the edit to the list in the meta issue here: elastic/apm-server#1090
|
|
||
| The sample rate will impact all four performance categories, | ||
| so simply turning down the sample rate is an easy way to improve performance. | ||
|
|
There was a problem hiding this comment.
I'd probably add a line above the code example saying something like this:
Example setting the sample rate to 20%:
It feels a little abrupt going from the previous sentence directly to a code snippet
381dad1 to
841f278
Compare
@watson I'm not sure this is quite done yet, but I don't have any more time to work on this tonight. Feel free to make your own edits, otherwise I'll get back to it next Tuesday.
Fixes #193