SQL Timings Not Displaying #505
Description
I am implementing MiniProfiler based on the Samples.Mvc5 project included in the repo and am having an issue with the display of SQL timings. I am curious if something might be off in my setup, but I am not sure exactly what that might be.
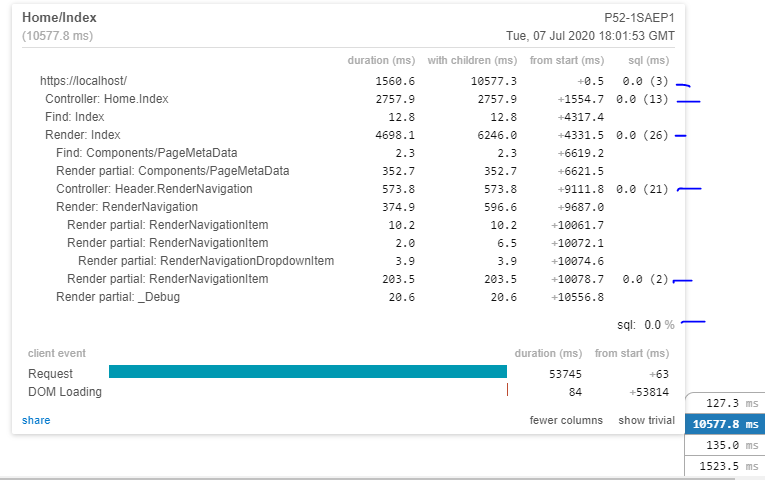
Here is an example of loading the homepage, and I am confused why the SQL timings and percentage all show as 0.0:
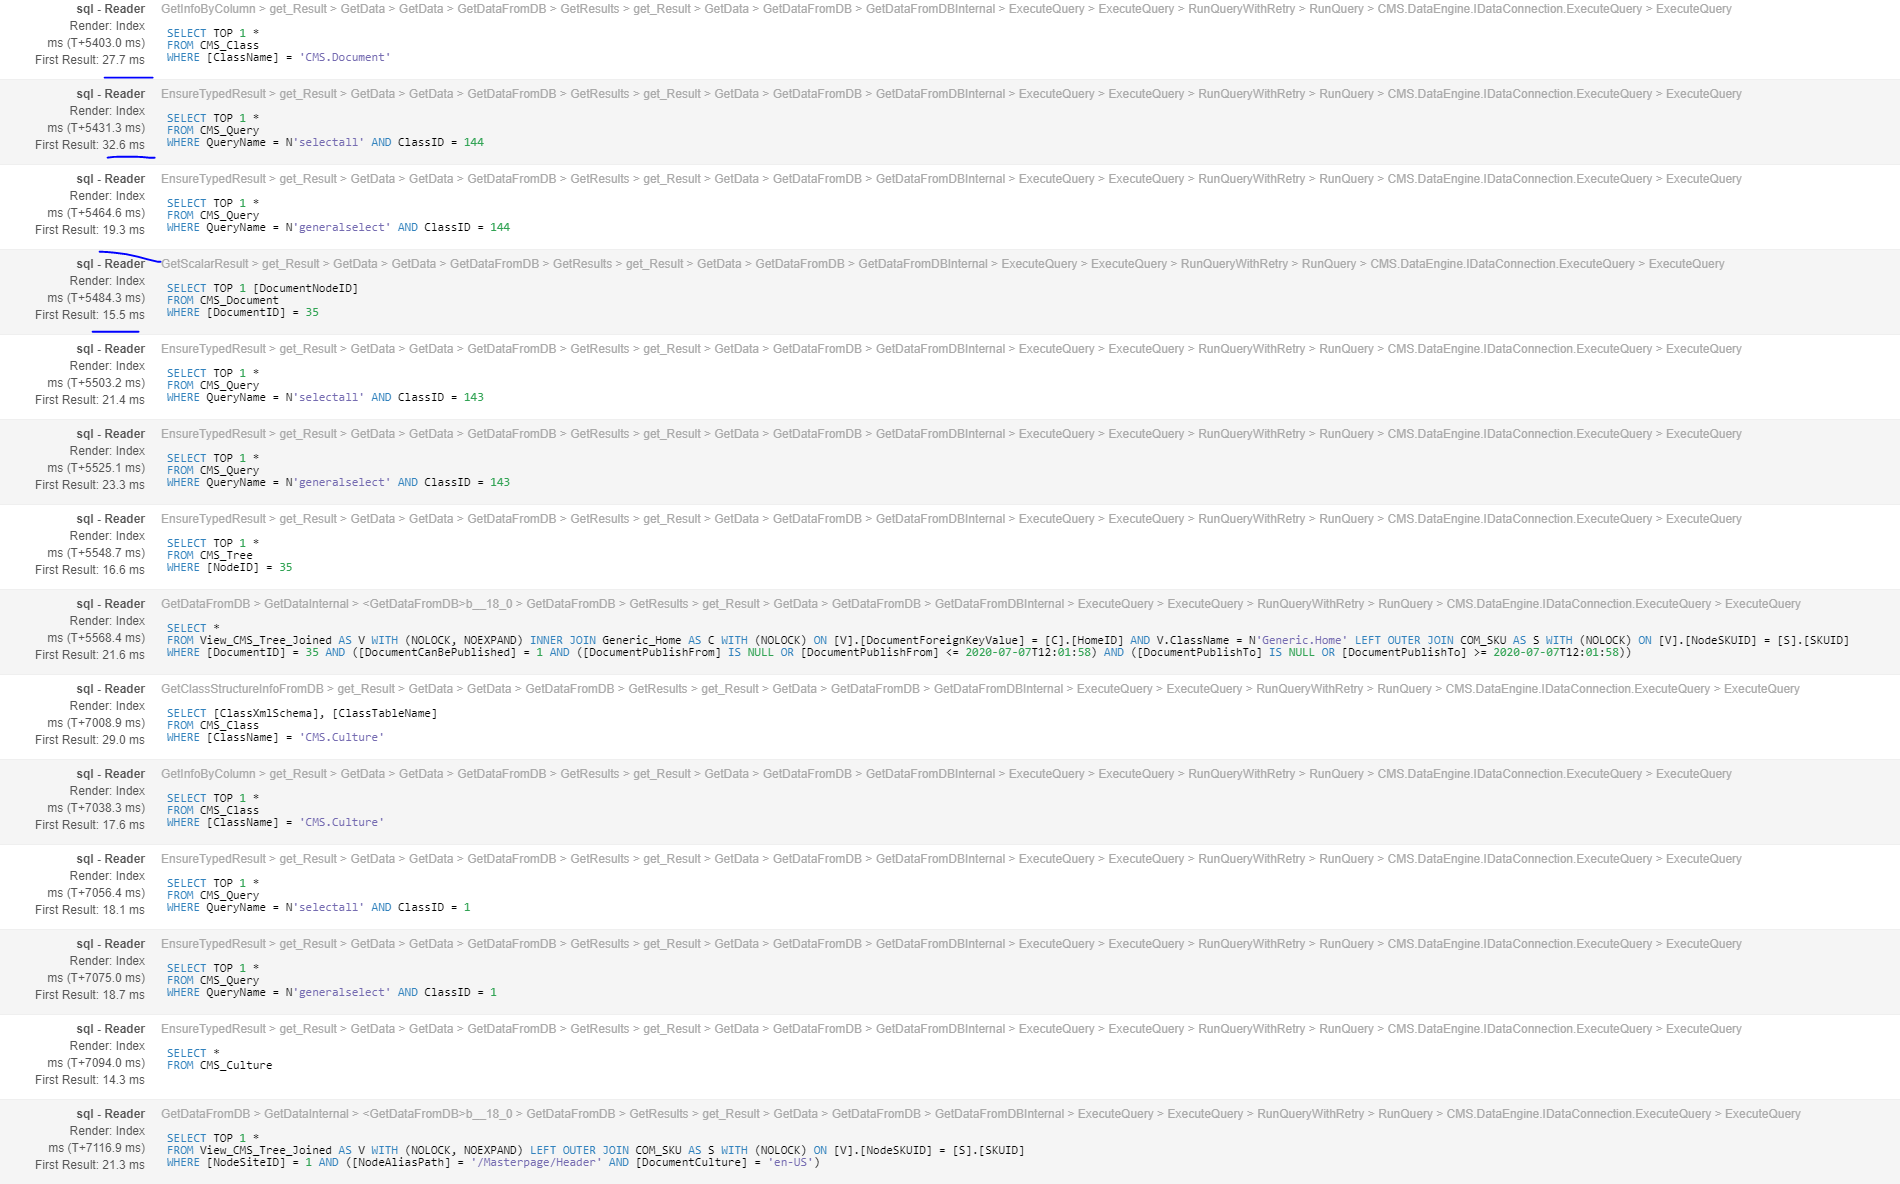
However, if I actually click on the sql timings I get this view, which does seem to indicate that each SQL call does have timings associated with it:
Can you help direct me as to why I might not be seeing them aggregated in the initial view, or where I might start looking to gather more info?